
Providing Insider News and Knowledge to Investors
Morning Report: A bullish signal for NFI Group
March 27, 2026Canada's morning overview of insider filings with a special focus on companies that may interest active and momentum-oriented investors.


Overview:Sentiment and Stocks
On March 11th, NFI Group reported 2025 revenue of $3.61 billion, up from $3.12 billion in 2024. It reported a net loss of $142.1 million ($1.19 per share) for the year versus a loss of $3.3 million ($0.03 per share) in 2024, but it notes that this was impacted by a voluntary battery recall which was realized in Q3 results; Q4 net income was $166 million ($1.39 per share), up from $18.6 million ($0.16 per share). 2025 Adjusted EBITDA was $335.7 million, up from $214.4 million the year before. Importantly, non-IFRS free cash flow was $67.8 million versus negative $17.8 million in 2024. For 2026, NFI Group provided revenue guidance of $3.9 to $4.2 billion, adjusted EBITDA from $370 to $410 million, and capital expenditures from $50 to $60 million. Meanwhile, a pair of insiders spent $351,623 picking up shares this week. It is typically a bullish signal when insider buying is paired with growing free cash flow.
Today's Charts
NFI Group Inc. (NFI)
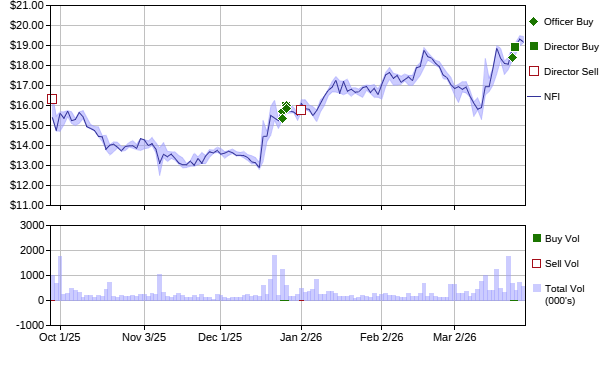
NFI Group currently holds a mostly sunny INK Edge outlook on the equally weighted V.I.P. criteria of valuations, insider commitment, and price momentum which places it in the top 30% of all stocks ranked. INK outlook categories are designed to identify groups of stocks that have the potential to out or underperform the market. However, any individual stock could surprise on the up or downside. As such, outlook categories are not meant to be stock-specific recommendations. For background on our INK Edge outlook, please visit our FAQ #3 at inkresearch.com.
Follow @INKResearch on Twitter/X, our INK Research YouTube channel, or our LinkedIn page.
Top-10 Tables: Yesterday's Activities
Tables represent public market transactions of directly held equity securities plus purchases and sales of these securities from the exercise of options by company officers and directors filed on or after March 27, 2026. Transactions filed on Saturday and Sunday are aggregated into Friday's number. INK may adjust certain filings for common filing errors on a reasonable efforts basis.
|
Top 10 Net "CO2" Buying
(By dollar amount, 000's)
|
||
|---|---|---|
| Type | Company Name | $ Value |
| M | Koryx Copper (KRY) |
$357.5
|
| M | Aimia (AIM) |
$13.7
|
| M | Chemtrade Log Inc Fnd (CHE) |
$3.2
|
| M | Carrier Connect Data (CCDS) |
$2.4
|
| M | Scottie Resources (SCOT) |
$1.8
|
| M | Intellabridge Technology (KASH) |
$0.3
|
| MO | Calfrac Well Services (CFW) |
$-108.5
|
| MO | Stingray Group (RAY) |
$-337.5
|
|
Top 10 Net "CO2" Selling
(By dollar amount, 000's)
|
||
|---|---|---|
| Type | Company Name | $ Value |
| MO | Stingray Group (RAY) |
$-337.5
|
| MO | Calfrac Well Services (CFW) |
$-108.5
|
| M | Intellabridge Technology (KASH) |
$0.3
|
| M | Scottie Resources (SCOT) |
$1.8
|
| M | Carrier Connect Data (CCDS) |
$2.4
|
| M | Chemtrade Log Inc Fnd (CHE) |
$3.2
|
| M | Aimia (AIM) |
$13.7
|
| M | Koryx Copper (KRY) |
$357.5
|
|
Top 10 Net Insider Buying
(By dollar amount, 000's)
|
||
|---|---|---|
| Type | Company Name | $ Value |
| M | South Bow (SOBO) |
$2,369.4
|
| M | Koryx Copper (KRY) |
$357.5
|
| M | Ag Growth Intl (AFN) |
$350.3
|
| M | NFI Group (NFI) |
$283.6
|
| MO | Scottie Resources (SCOT) |
$151.8
|
| M | Lavras Gold (LGC) |
$137.9
|
| M | TECSYS (TCS) |
$93.8
|
| M | NanoXplore (GRA) |
$88.0
|
| O | 01 Quantum (ONE) |
$46.0
|
| M | Aimia (AIM) |
$27.8
|
|
Top 10 Net Insider Selling
(By dollar amount, 000's)
|
||
|---|---|---|
| Type | Company Name | $ Value |
| M | Intact Financial (IFC) |
$-5,979.5
|
| M | Methanex (MX) |
$-3,075.3
|
| M | Artemis Gold (ARTG) |
$-2,038.5
|
| M | InterRent REIT (IIP) |
$-1,992.0
|
| MO | Valeura Energy (VLE) |
$-1,186.0
|
| M | Canopy Growth (WEED) |
$-415.7
|
| O | Tourmaline Oil (TOU) |
$-408.0
|
| MO | Stingray Group (RAY) |
$-391.8
|
| M | TransAlta (TA) |
$-270.0
|
| M | Journey Energy (JOY) |
$-115.1
|
|
Top 10 Net Insider Buying
(By volume, 000's)
|
||
|---|---|---|
| Type | Company Name | Volume |
| MO | Leading Edge Materials (LEM) |
628.0
|
| O | 01 Quantum (ONE) |
200.0
|
| M | Koryx Copper (KRY) |
110.7
|
| MO | Scottie Resources (SCOT) |
100.9
|
| M | Lavras Gold (LGC) |
70.0
|
| M | South Bow (SOBO) |
50.0
|
| M | NanoXplore (GRA) |
46.1
|
| MO | Calfrac Well Services (CFW) |
34.0
|
| M | Ag Growth Intl (AFN) |
20.0
|
| M | Verdera Energy (V) |
20.0
|
|
Top 10 Net Insider Selling
(By volume, 000's)
|
||
|---|---|---|
| Type | Company Name | $ Volume |
| M | Canopy Growth (WEED) |
-315.8
|
| M | Riley Gold (RLYG) |
-260.0
|
| M | InterRent REIT (IIP) |
-149.9
|
| M | Artemis Gold (ARTG) |
-50.0
|
| M | Methanex (MX) |
-37.7
|
| M | Intact Financial (IFC) |
-20.1
|
| M | Journey Energy (JOY) |
-20.0
|
| M | TransAlta (TA) |
-15.0
|
| M | EnGold Mines (EGM) |
-11.0
|
| M | Doubleview Gold (DBG) |
-2.7
|
Yesterday's Top 10 Individual Buy Filings
| Company Name | Insider Name | Security |
Unit/Share
|
Price
|
|---|---|---|---|---|
|
Leading Edge Materials (LEM)
|
Major, Daniel John
O
|
Common Shares
|
990,000
|
0.10
|
|
01 Quantum (ONE)
|
Macaulay, Tyson
O
|
Common Shares
|
200,000
|
0.23
|
|
Koryx Copper (KRY)
|
Daun, Heye Edmund
M
|
Common Shares
|
110,700
|
3.23
|
|
Scottie Resources (SCOT)
|
Mumford, Thomas
O
|
Common Shares
|
100,000
|
1.50
|
|
Valeura Energy (VLE)
|
Warrilow, Ian Mark
O
|
Common Shares
|
100,000
|
2.19
|
|
Calfrac Well Services (CFW)
|
Olinek, Michael Dean
O
|
Common Shares
|
60,000
|
3.54
|
|
Calfrac Well Services (CFW)
|
Olinek, Michael Dean
O
|
Common Shares
|
55,000
|
3.54
|
|
South Bow (SOBO)
|
Joung, Chansoo
M
|
Common Shares
|
50,000
|
34.23
|
|
Leading Edge Materials (LEM)
|
Major, Daniel John
M
|
Common Shares
|
43,000
|
0.28
|
|
NanoXplore (GRA)
|
Gagnon, Hélène Violaine
M
|
Common Shares
|
25,000
|
1.93
|
Yesterday's Top 10 Individual Sell Filings
| Company Name | Insider Name | Security |
Unit/Share
|
Price
|
|---|---|---|---|---|
|
Leading Edge Materials (LEM)
|
Major, Daniel John
M
|
Common Shares
|
-405,000
|
0.28
|
|
Canopy Growth (WEED)
|
Perron, Michael Alexander
M
|
Common Shares
|
-291,192
|
1.32
|
|
Riley Gold (RLYG)
|
Lamb, William
M
|
Common Shares
|
-260,000
|
0.40
|
|
Valeura Energy (VLE)
|
Warrilow, Ian Mark
M
|
Common Shares
|
-100,000
|
14.05
|
|
InterRent REIT (IIP)
|
Leslie, Ronald A.
M
|
Trust Units
I
|
-93,103
|
13.29
|
|
Artemis Gold (ARTG)
|
Langford, Jeremy
M
|
Common Shares
A
|
-50,000
|
40.77
|
|
InterRent REIT (IIP)
|
Amirault, Paul
M
|
Trust Units
I
|
-46,750
|
13.30
|
|
Calfrac Well Services (CFW)
|
Olinek, Michael Dean
M
|
Common Shares
|
-42,321
|
6.35
|
|
Calfrac Well Services (CFW)
|
Olinek, Michael Dean
M
|
Common Shares
|
-38,639
|
6.39
|
|
Canopy Growth (WEED)
|
Perron, Michael Alexander
M
|
Common Shares
|
-24,640
|
1.33
|
Disclaimer:
User agrees to only use information contained in this report for the purposes as set out in section 6.2 of COMPANION POLICY 55-102CP TO NATIONAL INSTRUMENT 55-102 of the Canadian Securities Administrators and to comply with all privacy laws. INK provides general information. INK is not an investment advisory service, a financial planner, an investment advisor nor a securities advisor. INK does not purport to tell people, or suggest to people, what they should buy or sell for themselves. Opinions and recommendations contained herein should not be construed as investment advice. Do not assume that any recommendations, insights, charts, theories, or philosophies will ensure profitable investment. Users should always consult with and obtain advice from their professional licensed financial advisor, including their tax advisor, to determine the suitability of any investment. INK recommends that anyone making an investment or trading securities do so with caution. Users should perform full due diligence and investigate any security fully before making an investment or before the execution of a security trade based upon information learned through INK. Investors should obtain annual reports and other company information to complete their own due diligence in any investment. Neither INK nor anyone affiliated with INK is responsible for any investment decision made. INK has made all reasonable efforts to ensure that all information provided is accurate at the time of inclusion; however, there may be inadvertent and occasional errors. INK makes no guarantee of accuracy or completeness. Insider transaction filings are from SEDI®; SEDI® is a registered trade-mark owned by the Alberta Securities Commission. All information and opinion expressed herein is subject to change without notice. INK employees may have an ownership or investment interest in any stock mentioned in this report. Copyright © INK Research Corp. All rights reserved.